Main menu
You are here
Website Statistics
Coccinella's new website has been around for nearly a week (that page shows the date when I started writing the article, one day before the announcement has been published). So, I guess it is interesting to look at some website statistics (note that all statistics in this article are from the 25th of April until the 6 of May, unless stated elsewise).
Let's first start with the most impressive: the browser stats. If you think next chart is extraordinary cool, I have to tell you that these numbers are from the old Coccinella website, the new website's stats I'll show a bit further only get crazier. B-)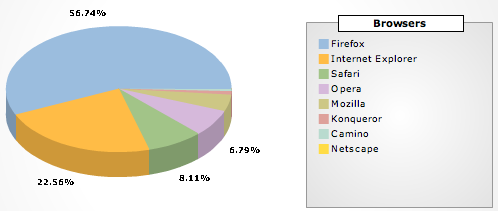
Firefox was used by nearly 57% of our visitors, Internet Explorer by around 22%, Safari by a little more than 8%, Opera by less than 7%, and some 6% used other browsers. The combined score for open-source browsers was more than 62%, and 70% for browsers based on open-source rendering engines (thus, including Safari).
The crazier graph: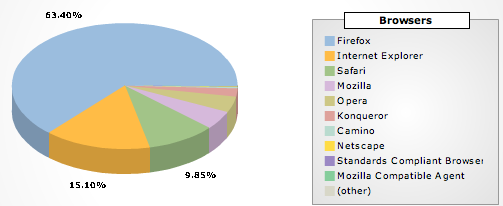
As you can see, Firefox was used by +63%, Internet Explorer by +15%, Safari by +9%, Mozilla and Opera both had around 4%, Konqueror 2%, and the rest was for other browsers. So, that's a ~70% market share for open-source browsers, and ~80% for open-source rendering engines. I also can tell you that the first two days since the website release, Firefox' usage increased to more than 69%(!), and Internet Explorer was the third browser (~10%), just behind Safari (~11%). This might be explained because both Mats and I mostly use Safari. But at least it is very cool to see that these two days open-source browsers had a +75% market share, and open-source rendering engines even +85%!
Not that bad statistics for open-source browsers if you look at surveys which show a market share for Firefox lower than 20%. The statistics of ejabberd's - currently much more visited - website show similar numbers, that is, Firefox more than 50%, and Internet Explorer less than 30%. I'm wondering...do these monitoring websites actually include statistics of technology related websites, or do only the visitors of Jabber websites care about open standards and do we therefore have such insane low Internet Explorer percentages? :o)
Anyway, these numbers might explain why Microsoft is forced to focus on open standards; they are probably afraid that websites with very low Internet Explorer numbers, do not care anymore about making workarounds for Internet Explorer's W3C bugs, and that this even might influence open-source CMSes where these websites rely on. If that would happen, a lot websites might start working worse under Internet Explorer than under open standards loving browsers...then the Web would start looking like the Jabber world (Be conservative in what you produce; be even more conservative in what you accept), as open-source browsers can start dropping their "liberal code" B-)
Ok, enough bright future talk, time for more graphs. Where our visitors came from last week: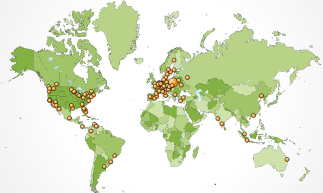
Some conclussions: Europe is the #1 location, the coasts of North America are #2, Africa seems not interested in instant messaging (I guess due to the lack of permanent Internet access), and there are even visitors from exotic places like Aruba.
Also cool is a comparison between the old and the new website. It is easy to see on next graphs when exacly we announced the new website: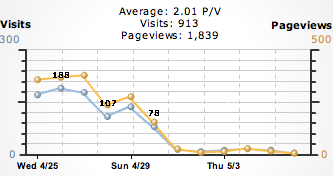
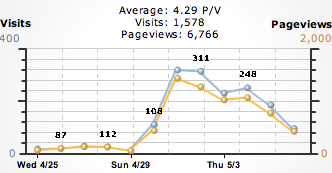
Not only does the new website attracts a lot more visitors without being pageranked by Google, also the number of pageviews per visit more than doubled.
This is all for today, hope you enjoyed the numbers. Of course I'll inform you when I can safely delete this file! ;-)
- Log in to post comments

Recent comments